A Full Stadium Is Only One Layer
A sold-out World Cup proves the world wants to watch. It does not tell you who collects on what they are watching.
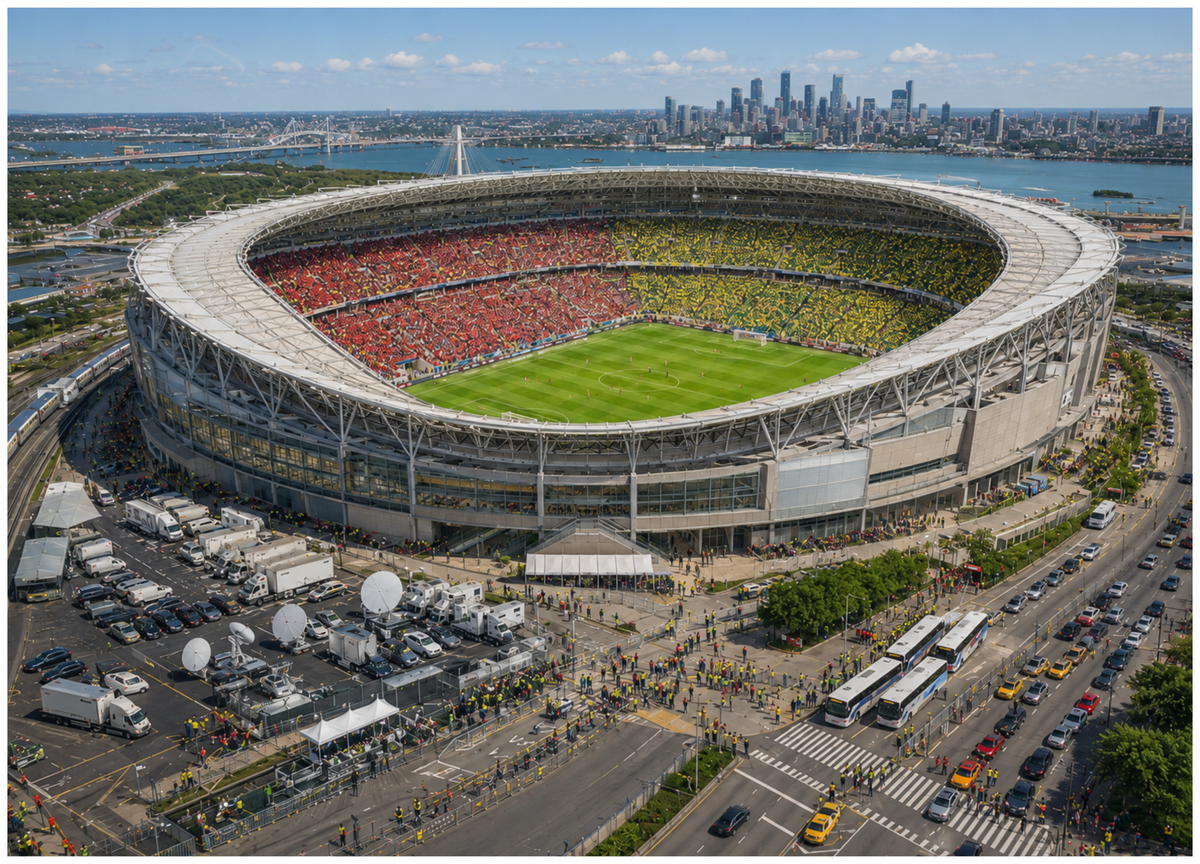
It is the cleanest image football produces. A stadium at capacity. Every seat filled. A wall of sound as the teams walk out.
The shot reads instantly, which is why broadcasts open with it. A full stadium means the event works. People came. The tournament is a success.
All of that is true. None of it tells you where the money is.
Before the tournament began, fans had submitted more than 500 million ticket requests — an average of around 15 million a day across a 33-day window, enough to oversubscribe the event roughly thirty times over. The all-time attendance record set in 1994 looks set to fall. By every visible measure, demand has never been higher.
But demand for seats and the business of the World Cup are not the same thing. The seat is the part you can see. It is not the whole map.
One seat is one line
Start with what a ticket actually is inside FIFA's accounts: a single revenue line, and not the one that carries the business.
In the 2019–2022 cycle — FIFA's last set of actual, audited figures — ticketing for all 64 matches in Qatar generated USD 686 million, from just over 3.18 million tickets sold. In the same cycle, the sale of television broadcasting rights brought in USD 3,426 million, about 45 percent of everything FIFA collected.
Read those two numbers side by side and the stadium settles into proportion. For every dollar that came through the turnstiles, several more came from the right to point a camera at what happened inside. The fan in the seat is real, and matters. But the larger value in FIFA's ledger sits somewhere the fan never sees.
A full stadium tells you the seats sold. It does not tell you that the seats were ever the main product.
The match becomes inventory
What FIFA sells above the seat is the audience the match creates.
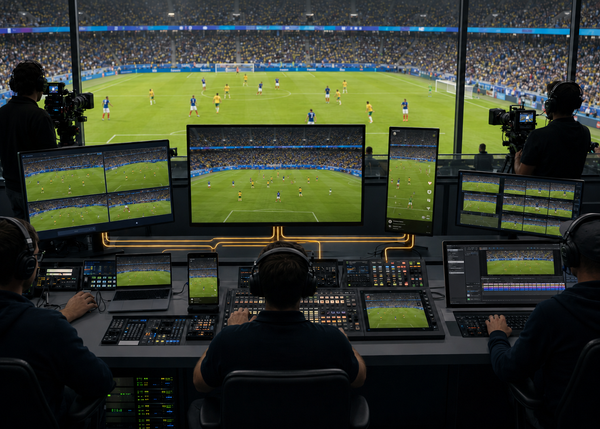
A sold-out stadium is a local event — tens of thousands of people, in one city, on one night. A broadcast is a global one. More than five billion people followed Qatar 2022 across various channels — over half the planet — against the roughly 3.18 million who were there in person. The same ninety minutes, packaged and licensed onto screens in more than 200 territories, is what turns a football match into commercial inventory. FIFA's original budget for the 2023–2026 cycle put broadcasting at around USD 4.26 billion — the single largest line in the plan.
Sponsors buy that same audience from the other side. FIFA's top-tier partners — names like adidas, Coca-Cola and Visa — are not paying for stadium seats. They are paying for association with the audience those seats represent, an audience that lives mostly on screens, not in the stands. Marketing rights were worth USD 1,795 million in the last actual cycle and were budgeted near USD 2.69 billion in this one.
This is the part the wide shot hides. The crowd in the stands is a customer once. As a global audience, it becomes part of the product.
The same event, sold again
The stadium is also sold a second way — not wider, but higher.
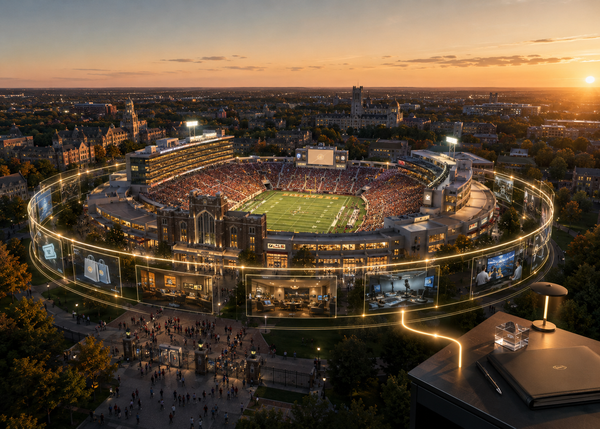
Around the ordinary ticket sits a premium layer: hospitality. For 2026, FIFA's official provider, On Location, has run what both describe as the largest hospitality programme in World Cup history — more than 500,000 packages allocated, with reported revenue that had already passed Qatar 2022's entire hospitality total a year before kickoff and, by early 2026, more than doubled any previous edition. Roughly half went to private buyers, half to companies.
The detail that matters is structural. For 2026, FIFA moved hospitality away from the older model of selling those rights to an outside operator, and toward running the programme more directly — keeping more of the premium for itself. Taken together, hospitality and ticketing are budgeted as FIFA's second-largest revenue stream for this cycle, behind only broadcasting.
So the same match, the same ninety minutes, can be sold twice: once as attendance, once as access. A full stadium does not reveal that split. It just looks full.
The bill the camera does not show
Every layer so far has been revenue. The ledger has another side, and it sits mostly outside the frame.
A full stadium has to be reached, secured, policed and cleaned. Most of those obligations fall on the host cities, not on FIFA. In the United States, the federal government allocated about USD 625 million in security grants across host cities, plus roughly USD 100 million to help transit agencies move the crowds; individual cities have estimated their own costs at USD 100–200 million each. In Canada the figures run higher still: British Columbia now projects the gross cost of Vancouver's seven matches at between CAD 685 million and CAD 729 million, though it expects most of that offset by tourism revenue, a hotel tax and federal contributions, leaving a net cost in the range of CAD 90–114 million.
What host cities largely do not receive is a share of the match itself. Reporting on the 2026 host-city contracts indicates that cities generally see no cut of game-day ticket sales, concessions, merchandise or parking, and that FIFA secures tax exemptions on top. The stadium fills; much of what happens commercially inside it flows past the city that paid to host it.
This is not a claim that hosting never pays. Cities and provinces pursue tourism, visibility and a concentrated month of activity, and some of that return is real and planned for. The narrower point holds: a full stadium is shared as an image, but the costs and the takings are not shared the same way.
What a full stadium actually proves
Put the layers back together and the picture is clearer than the single shot suggests.
A full stadium proves one thing well: that people wanted to be there. That is genuine, and 2026's demand is genuinely historic. It is also worth saying plainly that part of the record is arithmetic — 104 matches instead of 64 means far more seats to fill and far more tickets to sell — but the appetite underneath is real all the same.
What a full stadium cannot show is who captures the value built on top of that appetite. The seat is one line. The broadcast is the larger one. The sponsor pays for the audience, not the room. The hospitality buyer pays again for the same match. The host city pays to make all of it possible and does not share in the match-day take in the same way. And above every layer sits the rights holder, who fills not a single seat and prices every one.
The crowd tells you the world wanted to watch.
The ledger tells you who gets paid when it does.
Note on framing
A full stadium is proof of demand — not proof of profit, and not proof of loss for anyone in particular. Host cities and provinces carry real costs and also plan for real, if contested, returns. The 2019–2022 figures are actual; the 2023–2026 figures are budgeted, and budgeted revenue is not earned revenue. The argument here is structural, not an accusation: the layers simply do not point to the same place.
Sources
- FIFA Annual Report 2022 — Revenue 2019–2022 Primary source · Total revenue, broadcasting, marketing, hospitality and ticketing figures for the 2019–2022 cycle.
- FIFA Annual Report 2022 — Budget comparison Primary source · Revenue split across FIFA's major commercial lines.
- FIFA — 2023–2026 cycle budget Primary source · Broadcasting, marketing, hospitality and ticketing budget figures for the current cycle.
- FIFA — Over 500 million ticket requests Primary source · Random Selection Draw demand, including the 33-day request window.
- FIFA — Last-minute ticket sales phase Primary source · Context on the 1994 attendance record and 2026 ticket demand.
- On Location / FIFA — Hospitality programme records Primary source · Package allocation, sales records and buyer mix.
- Province of British Columbia — Updated World Cup cost projections Primary source · Vancouver gross and net cost projections.
- FEMA — FIFA World Cup Grant Program Primary source · $625 million in federal security grants to the 11 U.S. host cities.
- ProPublica — World Cup host-city revenue arrangements Context source · Contract terms and the limited game-day revenue retained by host cities.
- ITEP — Host-city costs and ticket sales-tax exemptions Context source · Per-city cost estimates and tax treatment.
- CBC — Vancouver World Cup cost projections Context source · Updated British Columbia cost projections.
- ESPN — Why haven't World Cup host cities received $625 million of critical funding? Context source · Federal security-grant delays and the roughly $100 million in host-city transit funding.
- PBS / PolitiFact — World Cup ticket-demand context Context source · The "unprecedented demand" claim and the expanded-format caveat.
Pitch & Ledger
Get the systems behind the spectacle in your inbox.
Independent sports-business analysis, delivered free.